
DeepGraph is an open-source Python implementation of a new network representation introduced here. Its purpose is to facilitate data analysis by interpreting data in terms of network theory.
The basis of this software package is Pandas, a fast and flexible data analysis tool for the Python programming language. Utilizing one of its primary data structures, the DataFrame, we represent objects (i.e. the nodes of a network) by one DataFrame, and their pairwise relations (i.e. the edges of a system) by another DataFrame.
One of the main features of DeepGraph is an efficient and scalable creation of edges. Given a set of nodes in the form of a DataFrame (or an on disc HDFStore), DeepGraph’s core class provides methods to iteratively compute pairwise relations between the nodes (e.g. similarity/distance measures) using arbitrary, user-defined functions on the nodes’ features. These methods provide arguments to parallelize the computation and control memory consumption, making them suitable for huge data-sets and adjustable to whatever hardware you have at hand (from netbooks to cluster architectures).
Furthermore, once a graph is constructed, DeepGraph allows you to partition its nodes, edges, or the entire graph by the graph’s properties and labels, enabling the aggregation, computation, and allocation of information on and between arbitrary groups of nodes. These methods also let you express elaborate queries on the information contained in a deep graph.
DeepGraph is not meant to replace or compete with already existing Python network libraries, such as NetworkX or graph_tool, but rather to combine and extend their capabilities with Pandas’ merits. The core class of DeepGraph provides interfacing methods to convert to common network representations and graph objects of popular Python network packages.
Deepgraph also implements several useful plotting methods, including drawings on geographical map projections.
It’s also possible to represent multilayer networks by deep graphs. We’re thinking of implementing an interface to a suitable package dedicated to the analysis of multilayer networks.
Installation
DeepGraph can be installed via pip from PyPI
pip install deepgraphRequirements
The easiest way to get Python and the required/optional packages is to use Conda (or Miniconda), a cross-platform (Linux, Mac OS X, Windows) Python distribution for data analytics and scientific computing.
Python
To use DeepGraph you need Python 2.7, 3.4 or later.
Pandas
Pandas is an open source, BSD-licensed library providing high-performance, easy-to-use data structures and data analysis tools for the Python programming language.
Pandas is the core dependency of DeepGraph, and it is highly recommended to install the recommended and optional dependencies of Pandas as well.
NumPy
NumPy is the fundamental package for scientific computing with Python.
Needed for internal operations.
Recommended Packages
The following are recommended packages that DeepGraph can use to provide additional functionality.
Matplotlib
Matplotlib is a python 2D plotting library which produces publication quality figures in a variety of hardcopy formats and interactive environments across platforms.
Allows you to use the plotting methods of DeepGraph.
Matplotlib Basemap Toolkit
basemap is an add-on toolkit for matplotlib that lets you plot data on map projections with coastlines, lakes, rivers and political boundaries. See the basemap tutorial for documentation and examples of what it can do.
Used by plot_map and plot_map_generator to plot networks on map projections.
PyTables
PyTables is a package for managing hierarchical datasets and designed to efficiently and easily cope with extremely large amounts of data.
Necessary for HDF5-based storage of pandas DataFrames. DeepGraph’s core class may be initialized with a HDFStore containing a node table in order to iteratively create edges directly from disc (see create_edges and create_edges_ft).
SciPy
SciPy is a Python-based ecosystem of open-source software for mathematics, science, and engineering.
Allows you to convert from DeepGraph’s network representation to sparse adjacency matrices (see return_cs_graph).
NetworkX
NetworkX is a Python language software package for the creation, manipulation, and study of the structure, dynamics, and functions of complex networks.
Allows you to convert from DeepGraph’s network representation to NetworkX’s network representation (see return_nx_graph).
Graph-Tool
graph_tool is an efficient Python module for manipulation and statistical analysis of graphs (a.k.a. networks).
Tutorials
This is a short introduction to DeepGraph. In the following, we demonstrate DeepGraph’s core functionalities by a toy data-set, “flying balls”.
First of all, we need to import some packages
# for plots
import matplotlib.pyplot as plt

# the usual
import numpy as np
import pandas as pd

import deepgraph as dg

# notebook display
%matplotlib inline
plt.rcParams['figure.figsize'] = 8, 6
pd.options.display.max_rows = 10
pd.set_option('expand_frame_repr', False)
Loading Toy Data
Then, we need data in the form of a pandas DataFrame, representing the nodes of our graph
v = pd.read_csv('flying_balls.csv', index_col=0)
print(v)
time x y ball_id
0 0 1692.000000 0.000000 0
1 0 8681.000000 0.000000 1
2 0 490.000000 0.000000 2
3 0 7439.000000 0.000000 3
4 0 4998.000000 0.000000 4
... ... ... ... ...
1163 45 2812.552734 16.503178 39
1164 46 5686.915998 14.161693 10
1165 46 3161.729086 19.381823 14
1166 46 5594.233413 57.701712 37
1167 47 5572.216748 20.588750 37
[1168 rows x 4 columns]The data consists of 1168 space-time measurements of 50 different toy balls in two-dimensional space. Each space-time measurement (i.e. row of v) represents a node.
Let’s plot the data such that each ball has it’s own color
plt.scatter(v.x, v.y, s=v.time, c=v.ball_id)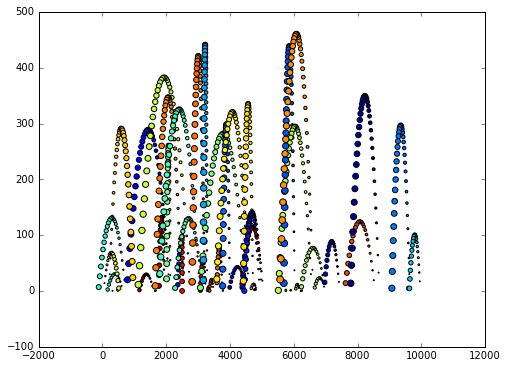
Creating Edges
In order to create edges between these nodes, we now initiate a dg.DeepGraph instance
g = dg.DeepGraph(v)
g
<DeepGraph object, with n=1168 node(s) and m=0 edge(s) at 0x7facf3b35dd8>and use it to create edges between the nodes given by g.v. For that matter, we may define a connector function
def x_dist(x_s, x_t):
    dx = x_t - x_s
    return dx
and pass it to g.create_edges in order to compute the distance in the x-coordinate of each pair of nodes
g.create_edges(connectors=x_dist)
g
<DeepGraph object, with n=1168 node(s) and m=681528 edge(s) at 0x7facf3b35dd8>print(g.e)dx
s t
0 1 6989.000000
2 -1202.000000
3 5747.000000
4 3306.000000
5 2812.000000
... ...
1164 1166 -92.682585
1167 -114.699250
1165 1166 2432.504327
1167 2410.487662
1166 1167 -22.016665
[681528 rows x 1 columns]Let’s say we’re only interested in creating edges between nodes with a x-distance smaller than 1000. Then we may additionally define a selector
def x_dist_selector(dx, sources, targets):
    dxa = np.abs(dx)
    sources = sources[dxa <= 1000]
    targets = targets[dxa <= 1000]
    return sources, targets
and pass both the connector and selector to g.create_edges
g.create_edges(connectors=x_dist, selectors=x_dist_selector)
g
<DeepGraph object, with n=1168 node(s) and m=156938 edge(s) at 0x7facf3b35dd8>print(g.e)dx
s t
0 6 416.000000
7 848.000000
19 -973.000000
24 437.000000
38 778.000000
... ...
1162 1167 -44.033330
1163 1165 349.176351
1164 1166 -92.682585
1167 -114.699250
1166 1167 -22.016665
[156938 rows x 1 columns]There is, however, a much more efficient way of creating edges that involve a simple distance threshold.